Among the most common segmentation methodologies, the RFM score owes its popularity to its simplicity, comprehensibility, and ability to predict donor behavior. To make the most of this scoring, we offer a detailed overview of how it works.
What is the RFM score?
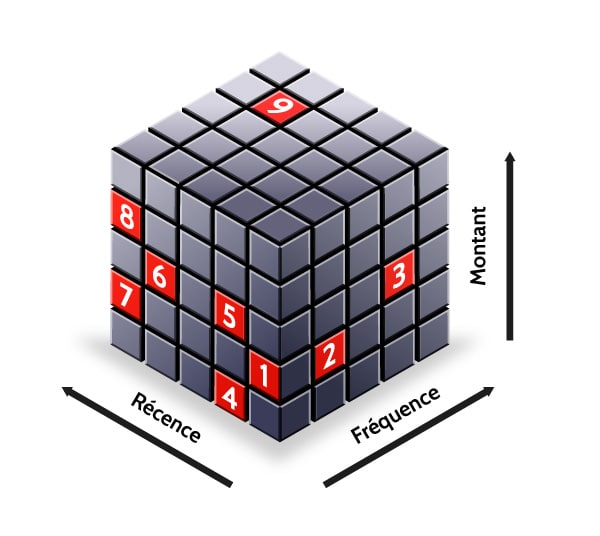
In the race to retain your donors, it is essential to know their buying or donation behavior. These behaviors can be identified based on 3 criteria: the recency and frequency of purchases, as well as the amount of donations. Combining these 3 criteria allows you to score your targets according to 9 profiles that can be placed in a cube (or triaxial table):
- 1 : donors lost for a long time
- 2 : unconfirmed donors
- 3 : recently lost regular donors
- 4 : recent donors with modest transactions
- 5 : recent donors with high transactions
- 6 : regular donors in decline
- 7 : regular donors with modest transactions
- 8 : developing regular donors
- 9 : regular donors with high transactions

Knowing this, it will be easier for you to determine which actions and marketing campaigns are intended for which segments/profiles. Each of these profiles can be the subject of a specific strategy for your non-profit organization, making you more relevant in your interactions and thus optimizing your chances of conversion and/or retention.
How to effectively use the RFM score?
It is essential to determine the criteria for each variable (R, F, and M) in order to simplify the use of the RFM score. However, if these criteria are too numerous, the number of profiles may become unwieldy. It would be difficult to work with more profiles than the 9 previously identified.
For example:
- Recency can offer seniority ranges: “less than a year”, “between 1 and 3 years”, “between 3 and 5 years”, “more than 5 years”, etc.
- Frequency can be divided into time ranges: “several times a month”, “once a month”, “several times a year”, “once a year”, “less than once a year”, etc.
- Amount can be segmented by range: “from 0 to 1000€”, “from 1001 to 2000€”, etc.
It is important that these criteria be consistent with the reality of your association. We recommend that you not exceed 5 representative ranges per variable.
Next, you need to assign a score to each criterion for each variable (e.g., from 0 to 4). This will give you 3 coordinates that will allow you to place your donor in your triaxial table. They should theoretically be close to one of the 9 profiles.

Predicting behavior with RFM score and CRM
Because you establish when your donor last gave, the average regularity at which they give, and the average amount they contribute to support your cause, this method allows you to predict potential behaviors of your clients. When analyzed well, these elements can help your organization establish a forecast of activity. For fundraisers, this data can help them reach out to donors who have been silent and thus limit attrition.
This notably requires being equipped with a CRM solution. This will allow you to keep a history of the relationship with each donor (donations, interactions, campaigns, etc.) and assign them their score. Thus, at a glance, it is easy to know specifically what action to take with each donor. In the context of a campaign, segmentation by RFM score can target a whole group for a given communication.
Even more scores!
As we mentioned, the RFM score is among the most common. But perhaps it does not suit your needs? Of course, you can choose the criteria that are more relevant to your sector and activity: attrition, risk, profitability, seniority, potential, etc.
With Eudonet’s CRM, take advantage of the full power of the Score extension. Choose your own criteria and automate the scoring of your donors!

 By Agneta Ronceret


